
Market Declines are Part of Long-Term Investing
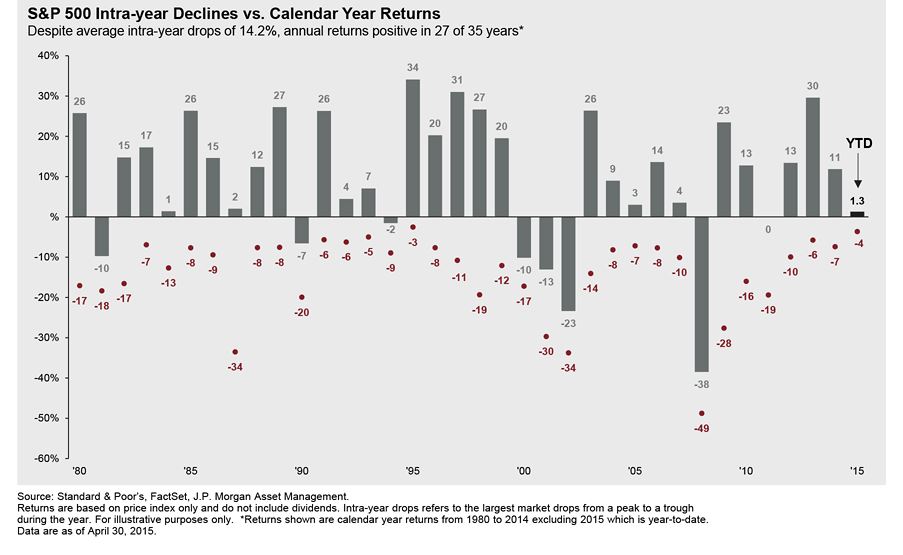
The above chart teaches some great lessons on investing. It shows two important data points per year for the S&P 500 Index from 1980 thru April 30, 2015. Those two points are 1) the overall rate of return including dividends each year shown as the grey bars, and 2) the largest intra-year drop that occurred during the year noted by the purple dots (in other words, the largest peak -to-trough decline). I’d like to point out a few observations.
First, there are a lot more positive growth years than negative. Through various levels of inflation, GDP growth, real estate and commodity prices, stocks have continued to climb 27 out of the 35 years on a calendar basis. This is great news for long-term, disciplined investors.
These long-term returns come with a price and that price is volatility. In every year, there has been some decline in stock prices. The average intra-year decline for this period is 14.2%. The traditional definition of a market correction is a 10% drop in stock values while a bear market is a 20% drop. In this time period, 19 years experienced a correction and 6 years had a bear market within that year. But despite the volatility, the average overall return for the S&P 500 from 1980 to 2014 was 11.8%*.
Many of these temporary market declines probably convinced some investors that the circumstances were different that time and the market wouldn’t recover. However, it has always recovered and provided patient investors with better long-term returns than fixed income investments.
The last market correction was three years ago, in June 2012. I have no idea when the next correction will come, but according to history we are overdue. It’s not a bad time to remind ourselves that corrections have happened several times and that the market has always recovered. It’s always easier to make rational decisions before the storm, so let’s commit now not to panic when the next correction or bear market comes along.
* Source: Dimensional Fund Advisors Matrix Book 2015
*This content is developed from sources believed to be providing accurate information. The information in this material is not intended as tax or legal advice. It may not be used for the purpose of avoiding any federal tax penalties. Please consult legal or tax professionals for specific information regarding your individual situation. The opinions expressed and material provided are for general information.